
022-29398436


Design scheme of sampling points in rivers and lakes
Agriculture, forestry, animal husbandry and fishery, industrial and mining enterprises, municipal engineering,hydrology
and water conservancy, scientific research institutions, real estate and construction industry, etc

Design scheme of sampling points in rivers and lakes
Determination of sampling points: after setting the monitoring section, the sampling vertical line on the section shall be determined according to the width of the water surface (see table 3-4), and then the position and number of sampling points shall be determined according to the depth of the sampling vertical line (see table 3-5).
Table 3-4 setting of sampling vertical line number
Water surface width
Number of vertical lines
explain
≤50m
One (thalweg)
1The vertical line should be set away from the pollution zone, and additional vertical line should be added to the pollution zone to be measured.
50-100m
Two (near left and right bank with obvious water flow)
2If it can be proved that the water quality of the section is uniform, only the thalweg vertical line can be set.3. When the pollutant flux is to be calculated in this section, it must be set according to this table
>100m
Three (left, middle, right)
Set the vertical line.
Table 3-5 sampling points setting on sampling vertical line
Water depth
Sampling points
explain
≤5m
A little bit up there
1The upper layer refers to the place 0.5m below the water surface and 1 / 2 of the water depth when the water depth is less than 0.5m.
2The lower layer refers to 0.5m above the river bottom.
5-10m
Upper and lower two points
3Middle layer refers to 1 / 2 depth of water.
>10m
Upper, middle and lower levels
45 m under the ice, and 1 / 2 of the water depth when the water depth is less than 0.5 m.
5If the pollutant content is to be calculated in this section, the sampling points must be set according to this table.
When there is temperature stratification in the water body of lakes and reservoirs, the number and location of sampling points can be determined according to the relationship between temperature distribution layer and sampling points (table 3-6).
Table 3-6 setting of vertical sampling points for Lake (reservoir) monitoring
Water depth
Stratification
Sampling points
explain
≤5m
One point (0.5m below water)
1Stratification refers to the stratification of lake water temperature.2. When the water depth is less than 1m, the measuring point is set at 1 / 2 of the water depth.3. When there is sufficient data to prove that the water quality of the vertical line is uniform, the number of measuring points can be reduced as appropriate.
5m-10m
No stratification
Two points (0.5m below water surface and 0.5m above water bottom)
5m-10m
layered
Three points (0.5m below water surface, 1 / 2 inclined temperature layer, 0.5m above water bottom)
>10m
Except 0.5m below the water surface and 0.5m above the water bottom, 1 / 2 of each inclined layer is set
Fig. 3-2 schematic diagram of sampling point setting in intermediate temperature layer A1: in the surface temperature layer;A2: under the interlayer;A3: in the subthermal layer;A4: about 1m above the interface between sediment and water medium;h: After the location of water depth monitoring section and sampling point is determined, there should be fixed and obvious natural signs on the bank.If there are no natural markers, artificial markers should be set up, such as vertical stone columns, piling, etc.Each sampling should be strictly based on the markers, so that the collected samples are taken from the same location, so as to ensure the representativeness and comparability of the samples.
Determination of sampling points: after setting the monitoring section, the sampling vertical line on the section shall be determined according to the width of the water surface (see table 3-4), and then the position and number of sampling points shall be determined according to the depth of the sampling vertical line (see table 3-5).
Table 3-4 setting of sampling vertical line number
|
Water surface width |
Number of vertical lines |
explain |
|
≤50m |
One (thalweg) |
1The vertical line should be set away from the pollution zone, and additional vertical line should be added to the pollution zone to be measured. |
|
50-100m |
Two (near left and right bank with obvious water flow) |
2If it can be proved that the water quality of the section is uniform, only the thalweg vertical line can be set.3. When the pollutant flux is to be calculated in this section, it must be set according to this table |
|
>100m |
Three (left, middle, right) |
Set the vertical line. |
Table 3-5 sampling points setting on sampling vertical line
|
Water depth |
Sampling points |
explain |
|
≤5m |
A little bit up there |
1The upper layer refers to the place 0.5m below the water surface and 1 / 2 of the water depth when the water depth is less than 0.5m. |
|
2The lower layer refers to 0.5m above the river bottom. |
||
|
5-10m |
Upper and lower two points |
3Middle layer refers to 1 / 2 depth of water. |
|
>10m |
Upper, middle and lower levels |
45 m under the ice, and 1 / 2 of the water depth when the water depth is less than 0.5 m. |
|
5If the pollutant content is to be calculated in this section, the sampling points must be set according to this table. |
When there is temperature stratification in the water body of lakes and reservoirs, the number and location of sampling points can be determined according to the relationship between temperature distribution layer and sampling points (table 3-6).
Table 3-6 setting of vertical sampling points for Lake (reservoir) monitoring
|
Water depth |
Stratification |
Sampling points |
explain |
|
≤5m |
|
One point (0.5m below water) |
1Stratification refers to the stratification of lake water temperature.2. When the water depth is less than 1m, the measuring point is set at 1 / 2 of the water depth.3. When there is sufficient data to prove that the water quality of the vertical line is uniform, the number of measuring points can be reduced as appropriate. |
|
5m-10m |
No stratification |
Two points (0.5m below water surface and 0.5m above water bottom) |
|
|
5m-10m |
layered |
Three points (0.5m below water surface, 1 / 2 inclined temperature layer, 0.5m above water bottom) |
|
|
>10m |
|
Except 0.5m below the water surface and 0.5m above the water bottom, 1 / 2 of each inclined layer is set |
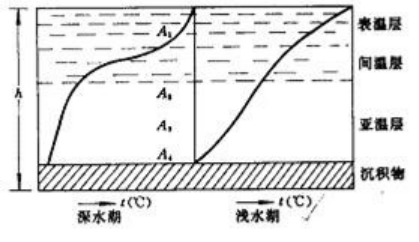
Fig. 3-2 schematic diagram of sampling point setting in intermediate temperature layer A1: in the surface temperature layer;A2: under the interlayer;A3: in the subthermal layer;A4: about 1m above the interface between sediment and water medium;h: After the location of water depth monitoring section and sampling point is determined, there should be fixed and obvious natural signs on the bank.If there are no natural markers, artificial markers should be set up, such as vertical stone columns, piling, etc.Each sampling should be strictly based on the markers, so that the collected samples are taken from the same location, so as to ensure the representativeness and comparability of the samples.
Not yet
Not yet
Not yet
Last product
:
No Data
No Data
:
Next product
Search
Please input your keywords to get to know our latest news and product information more quickly
Product hotline:022-29398436、022-89611509
(Working day AM8:00-PM 6:30)
Sales telephone: 17612237940、 13002245640
(24-hour Hotline)
QR code

Copyright © 绿环科技(天津)有限公司
support: 仙人球建站